SQL variables
Contents
SQL variables enable you to dynamically set values in your queries.
Creating SQL variables
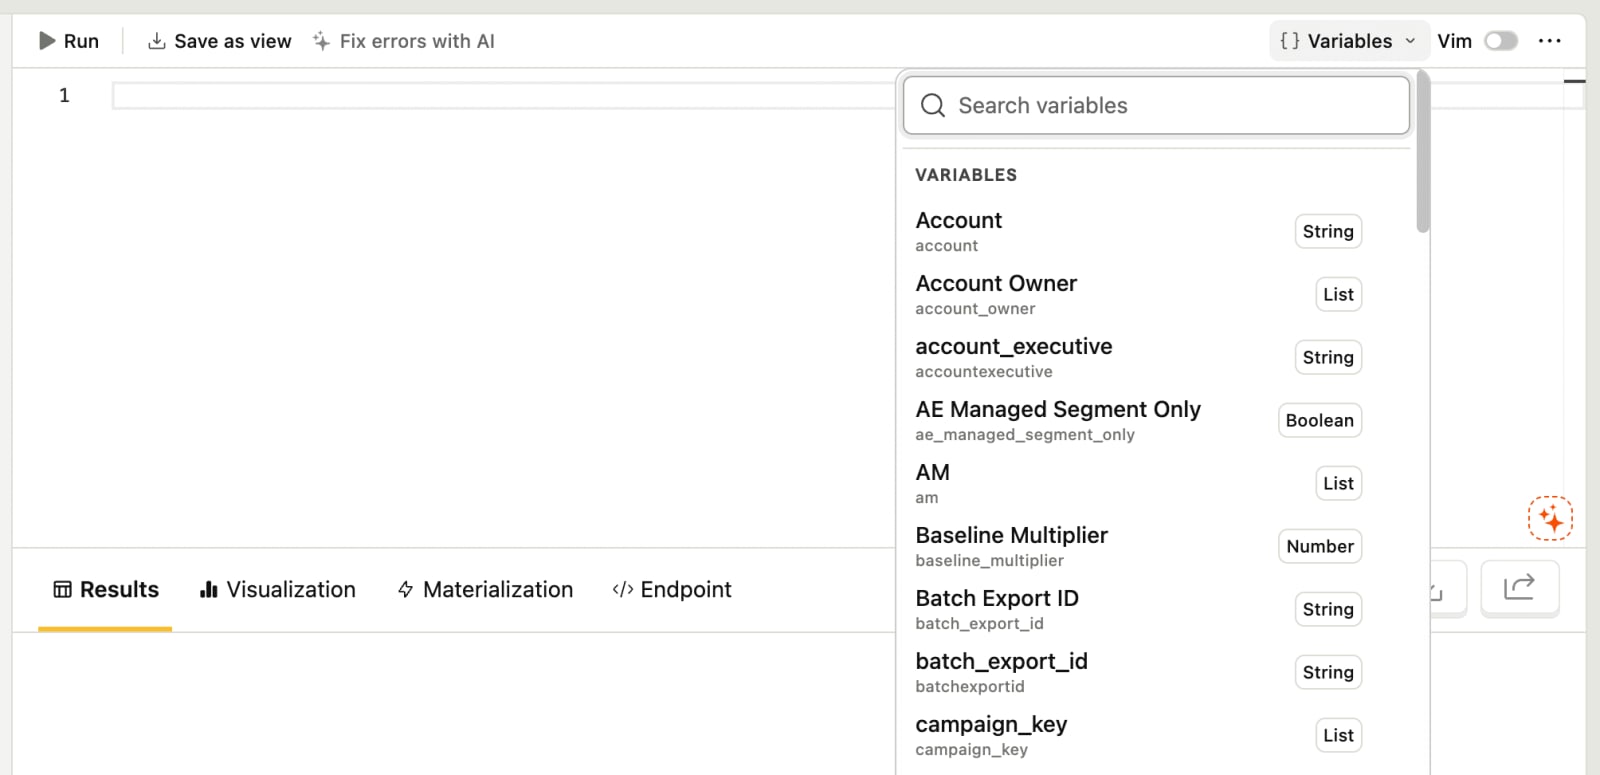
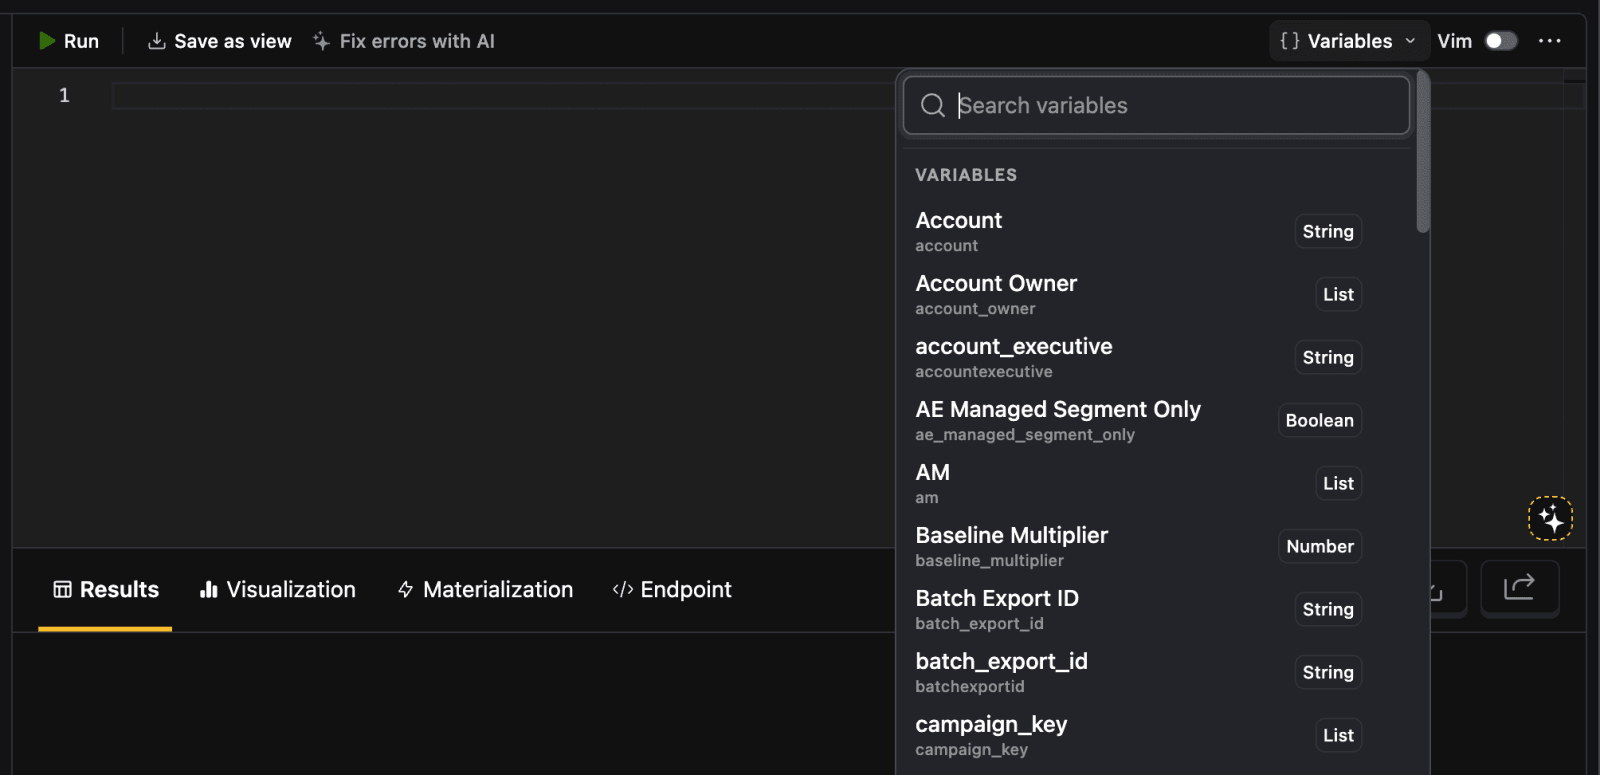
To create a variable, go to the SQL editor and click the Variables button in the top right toolbar. Start typing in your variable name, if it doesn't exist already, select New variable and create it. The variable is now available in any of your project's queries.
For example, you can create a List type variable with the code name event_names and add events like $pageview and $autocapture as values.
Using variables in SQL queries
Once created, variables can be used in queries with the {variables.<variable-name>} syntax like this:
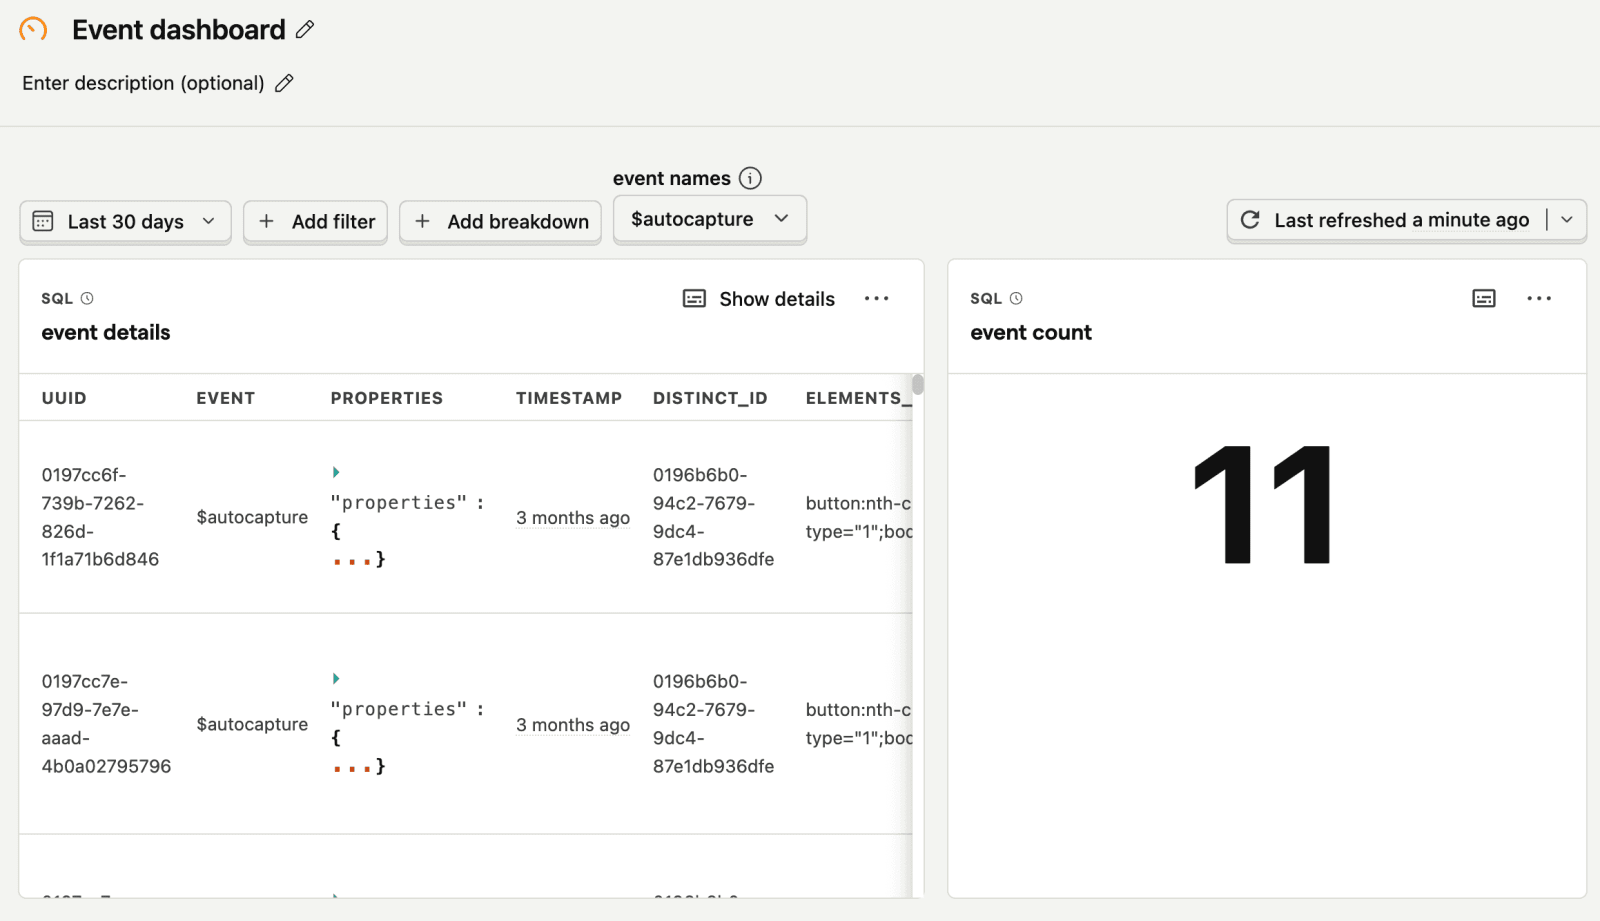
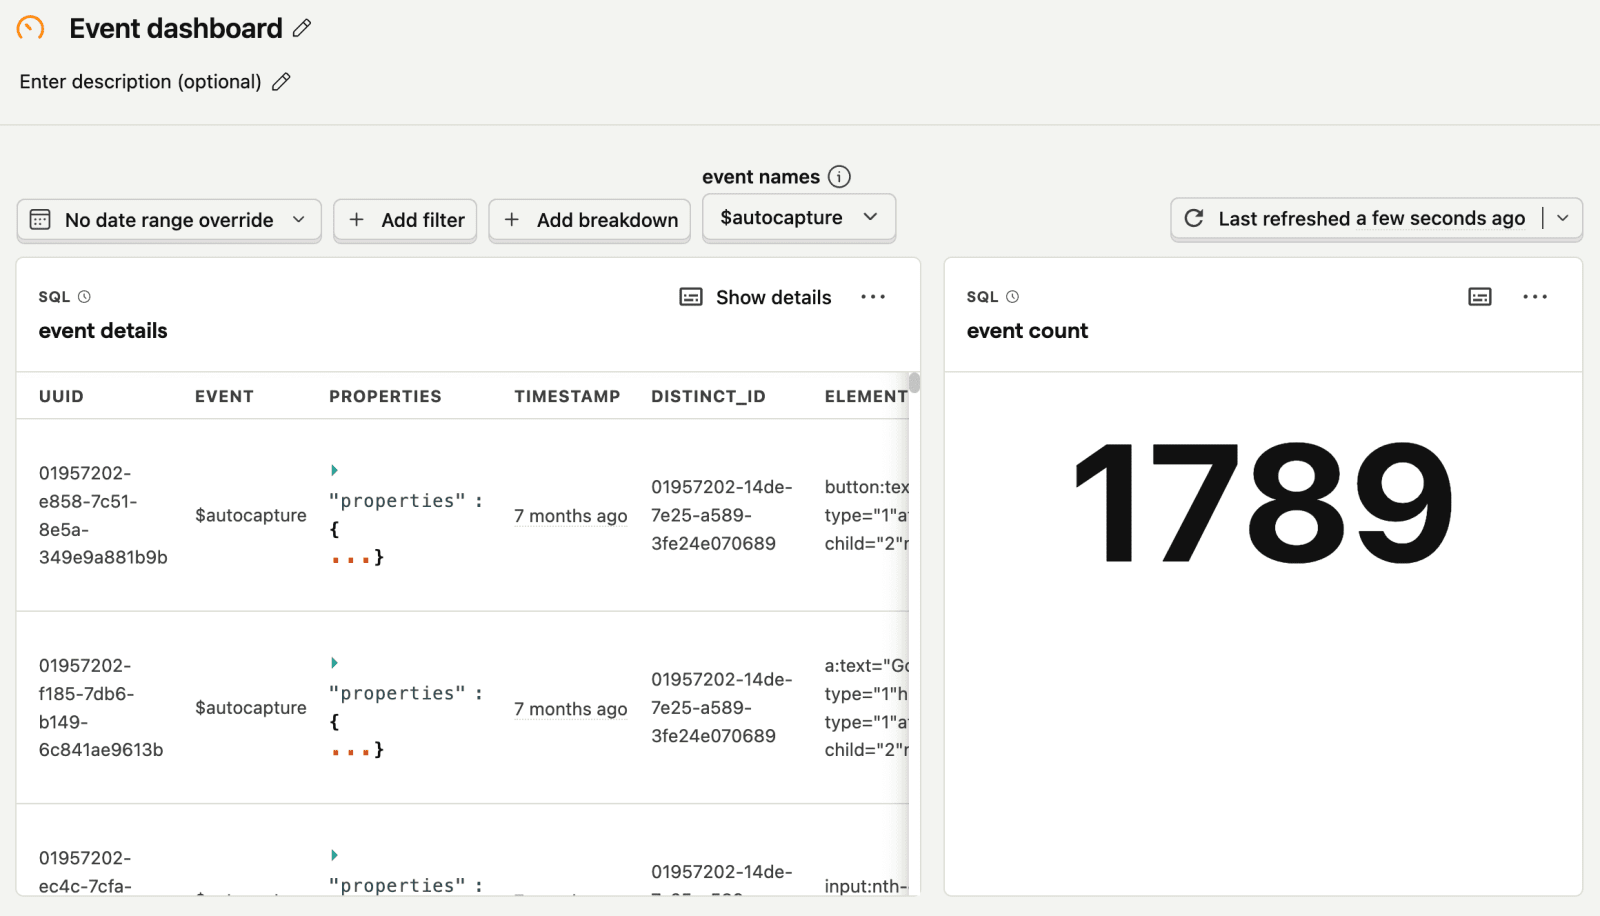
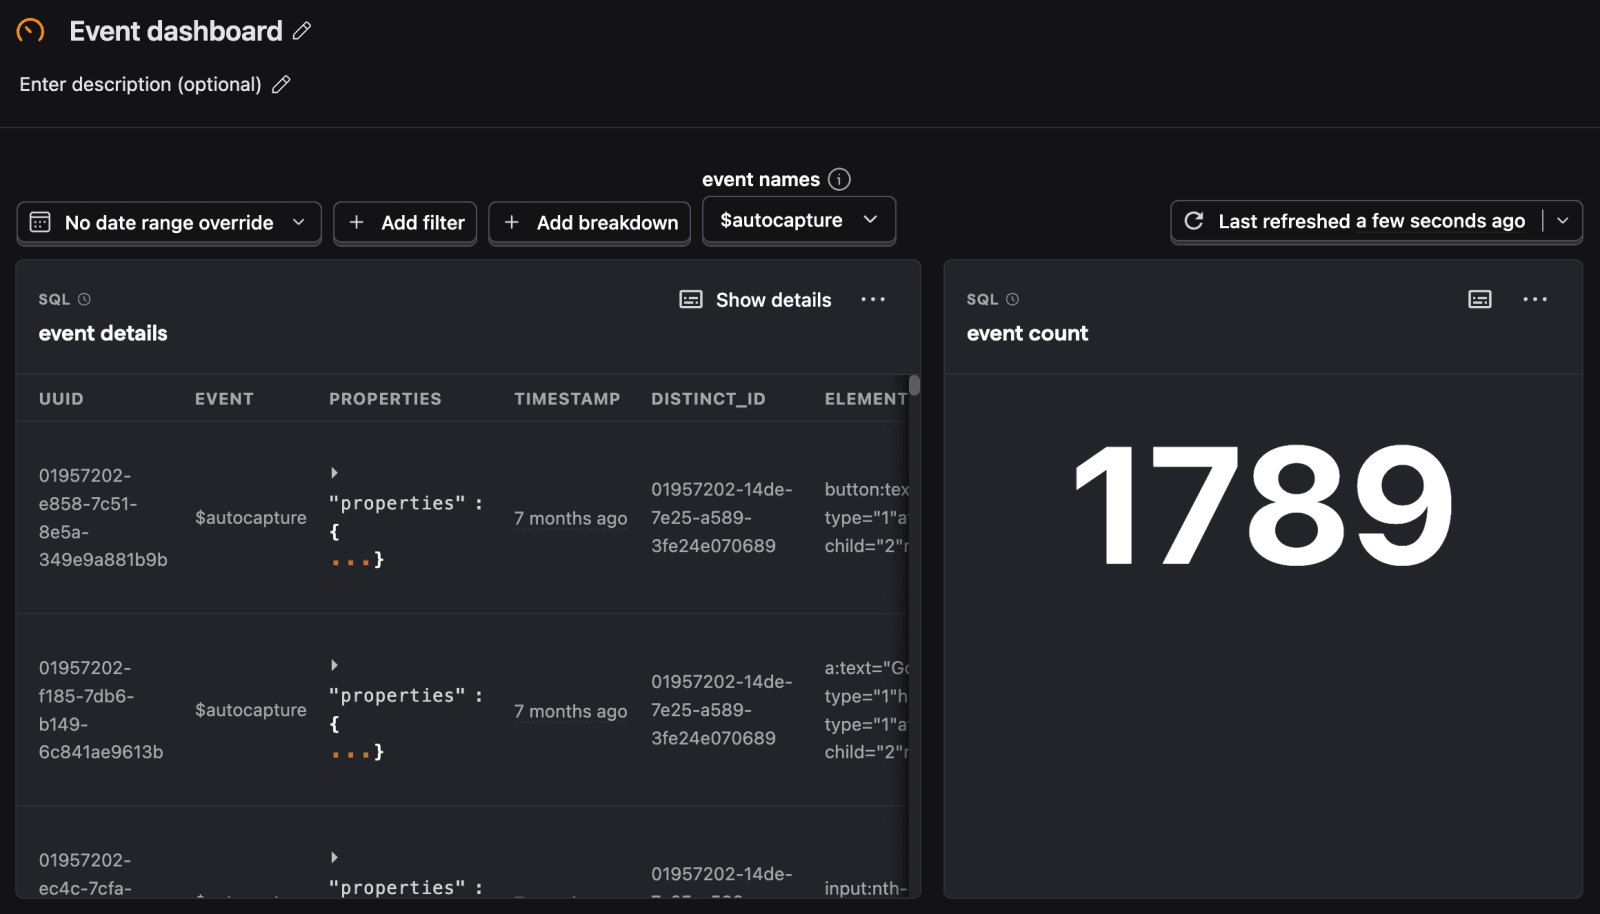
You can set the value for the variable in the Variables dropdown. For example, below we set the "event names" variable to $autocapture on a dashboard. This means every instance of {variables.event_names} in the queries on the dashboard is replaced with $autocapture.
Applying dashboard filters
Adding the {filters} placeholder to your query's where clause applies the dashboard or insight date range, property filters, and test account filtering to your query:
This works when selecting from PostHog tables: events, sessions, persons, groups, logs, and traces. The date range applies to timestamp on events, logs, and traces, to $start_timestamp on sessions, and to created_at on groups and persons.
Property filters resolve in the scope that fits the table. A query selecting only from persons takes person properties. Event properties show an error, because the query has no events to filter. A query that joins persons to events keeps event behavior: the date range applies to timestamp and properties resolve in event scope.
If person scope isn't what you want, bind the columns yourself instead.
Binding filters to columns
For any other table, view, or join (or to override the defaults above), tell PostHog which of your columns each filter applies to by binding them:
Each argument binds one of your query's expressions to a filter key with AS:
- The reserved key
timestampreceives the date range. - Any other key, written as a string like
'plan', receives the dashboard and insight property filters on that key. Operators and multiple values work like they do elsewhere in PostHog. null AS keyopts the query out of filtering on that key. For example,null AS timestampopts out of date filtering.
If a filter is active but not bound, the query shows an error instead of silently ignoring the filter. This way a filtered dashboard never shows unfiltered data. Cohort filters and SQL expression filters can't be bound and show an error too.
Test account filtering works the same way: when it's on for the insight, or forced on by the dashboard's own toggle, the properties your test account filters use need bindings too.
Applying the dashboard interval
Use {filters.interval} where a time unit goes, for example in dateTrunc:
The placeholder becomes the dashboard's interval as a string constant, like 'week'. The argument sets your default for when the dashboard doesn't set an interval. Without an argument, the default is 'day'. Valid intervals are second, minute, hour, day, week, month, quarter, and year.
Applying the dashboard breakdown
When the dashboard sets a breakdown, {filters.breakdown(...)} becomes the expression you bound to that breakdown key:
Bindings work like the column-bound form above: bind an expression to each breakdown key you support, or null AS 'plan' to opt out of one. Without a breakdown set, the placeholder becomes null and the query returns a single group, so it still runs outside the dashboard. A breakdown on an unbound key shows an error.
The placeholder supports a single plain breakdown. Cohort breakdowns, numeric binning, and multiple breakdowns show an error. The breakdown value shows up as a regular column in your results. Chart series don't split on it automatically.
The filter placeholders combine. This query takes its date range, property filters, interval, and breakdown from the dashboard:
Dashboard date range filter variables
Beyond the SQL variables you set up, you can access the dashboard's date range filters through the filters.dateRange.from and filters.dateRange.to variables like this: